Where does the carbon credit price come from?
This article, originally written in 2022 and updated in 2025, unpacks the key factors influencing carbon pricing, key sources for pricing data, and predictions on future price movements.
As you dig a little deeper into the world of carbon credits, one of the first obstacles you run into is the difficulty in understanding fair and prevailing market prices.
For most commodities like timber, you can easily look up futures prices at large marketplaces such as the Chicago Commodity Exchange, and may also have access to local price indices.
But when it comes to carbon credits, pricing is much more difficult to access and can be highly inconsistent. In this article, we break down why that is, where you can find credible pricing information, and what’s driving the wide range in prices today.
But first, what carbon credit price should we be tracking?
The very first thing we should note that “carbon credit price” is a very unclear term. Often it is used interchangeably for both voluntary market credits and for compliance market tonnes. However, as we covered in our article on the voluntary carbon market, compliance markets are fundamentally different from voluntary markets, and cannot be used as a proxy for each other.
So if you’ve heard or seen articles with headlines like “Carbon credit prices reach new highs”, keep in mind that they might be talking about compliance markets. At the time of writing this, the price of a tonne of carbon on the EU compliance carbon markets is hovering around €68/tCO2e (tonne of CO2 equivalent).
A very broad category called “Voluntary Market Nature Based Offsets”, which includes everything from cheap renewable energy credits to REDD projects, is currently priced at around $0.50/tCO2 (you can view carbon credit prices live on CarbonCredits.com). But compare that to higher-quality credits from offtake deals (not included in the average) and you'll see a completely different story.
High-quality removal credits come at significantly higher prices. For instance, Pachama, a respected provider of nature-based solutions, reports selling credits between $50–$82 per tonne. Another example is Netherlands-based Naturalis Biodiversity Center, which sold carbon removal credits from a Nattergal rewilding project at a price of €100 ($109) per tonne in July 2024.
Okay, so where can I find the latest carbon credit prices?
The good news is that as carbon becomes increasingly tradeable, there are emerging marketplaces and aggregators that provide some insight into average price.
The bad news is that these players are still highly fragmented, and hence have access to only a small selection of carbon credit prices. The result is large differences between the prices shown.
But nonetheless, here are a few sources you can explore:
- CarbonCredits.com - this uses the Verra registry to combine prices for “Nature Based Carbon” (defined as any project that falls under Agriculture, Forestry or Other Land Use), as well as “Aviation Industry” and “Tech Industry” offsets
- QCintel.com (behind a paywall) - shows spot prices by standard/registry type (e.g. VCS), high-level methodology (e.g. cookstoves, forestry) and vintage group (e.g. credits issued since 2016)
- MSCI (behind a paywall) - provides carbon credit pricing data covering over 50 indexes segmented by specific credit types and by region, vintage, project type, quality
- S&P Global Platts (behind a subscription paywall) - sometimes referenced in reports, e.g. in State and Trends of Carbon Pricing 2024 by World Bank
And… that’s basically it.
Other carbon credit cost data comes through word of mouth, from buyers and brokers.
Why are the carbon credit prices I’m seeing so widely spread?
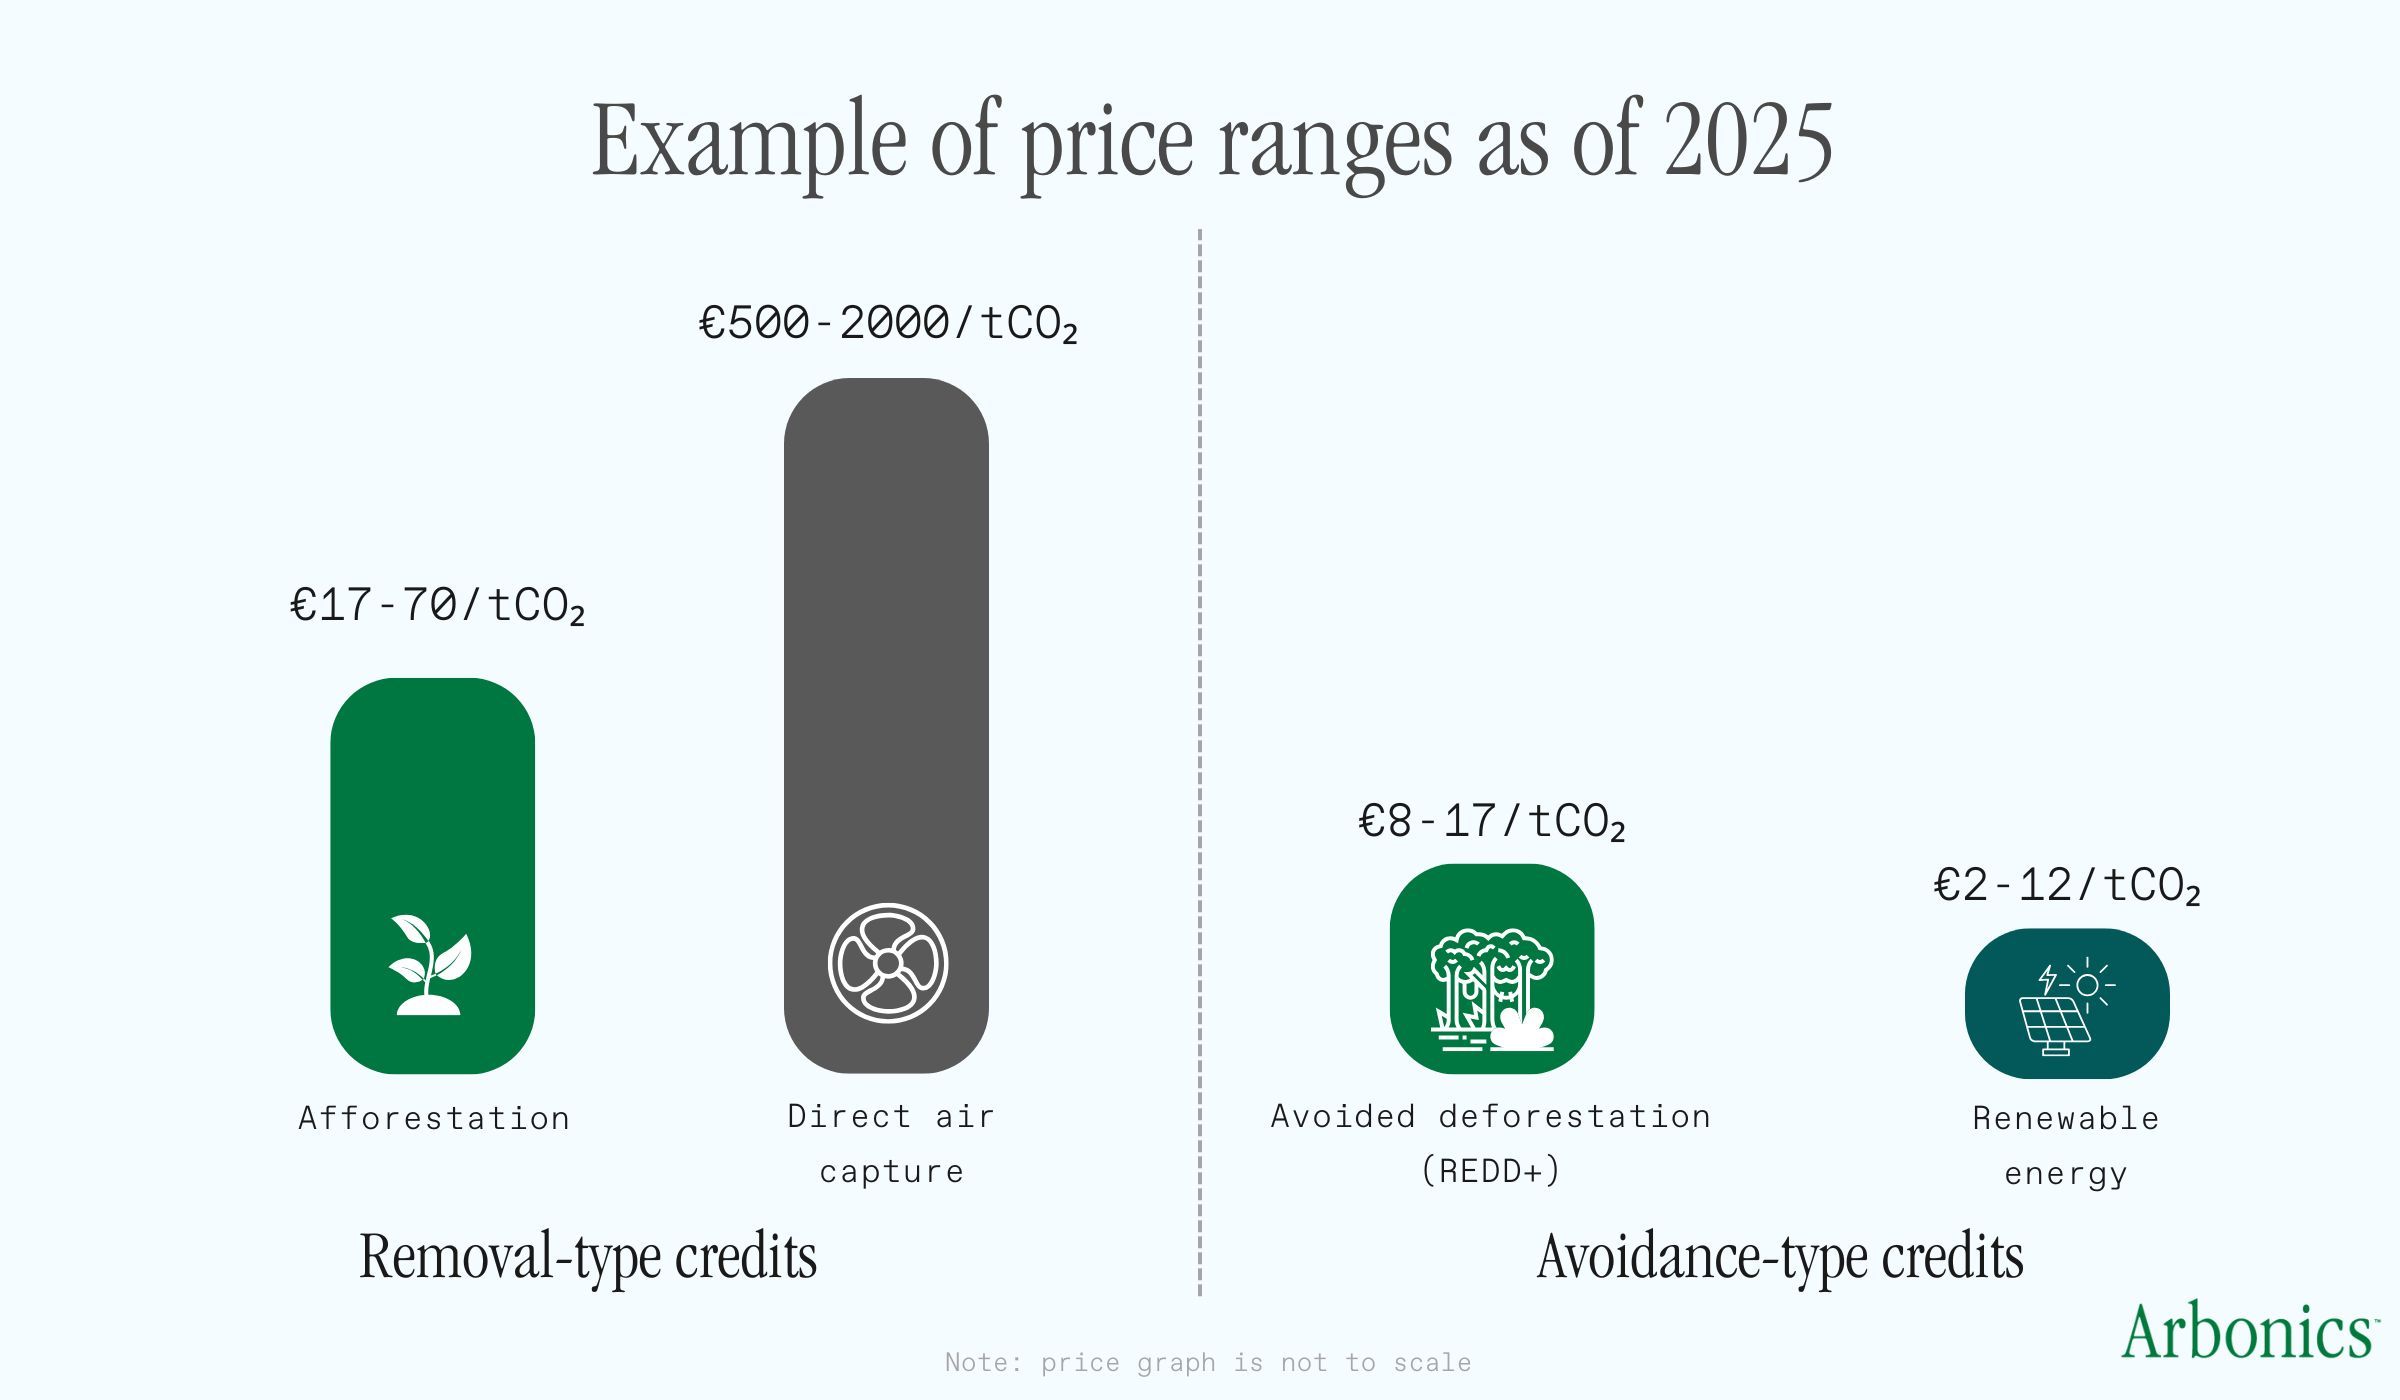
Often, different types of nature-based credits are lumped together, from afforestation to avoided deforestation to carbon-friendly farming techniques to biochar. In reality, these different approaches have very varied cost bases, and as a result, different tonne prices.
An avoidance credit (such as “avoided deforestation”) attempts to quantify the amount of emissions that are avoided (i.e. CO2 that would have otherwise been released)— in effect, people are paid to not cut down trees or not to burn wood. Avoidance-type credits often have a hard time proving additionality, and as a result, buyers are willing to pay much less for these.
In contrast, “removal”- type credits (e.g. growing trees) actually take CO2 out of the atmosphere. In general, these are priced higher than “avoidance”-type credits, because their effect is more clearly quantifiable and trackable.
In addition to these factors, carbon credit pricing info is often incomplete because many carbon credit purchases today are done through direct deals between credit developers and credit buyers, and these deal terms are not shared publicly.
This is especially true of higher-priced, higher-quality credits where buyers want direct insight into the project. In contrast, many “buy-with-one-click”-type online marketplaces sell primarily cheaper credits (around €2-5 per tonne of CO2), as the buyers buying small amounts of credits tend to be less selective about the provenance and methodology underlying them.
So which factors drive prices up?
Firstly, carbon credit prices are strongly influenced by the two main things buyers care about: additionality and permanence. We already address additionality when talking about price spread, so let’s tackle permanence here.
In short, permanence is a concept encapsulating how long carbon is tied up for, and what its risk of reversal (i.e. being re-released into the atmosphere) is. Permanence can range from 2-5 years (most farming-related soil carbon projects) to 1000+ years (direct air capture). For forestry-related projects, it can be anywhere from 30 to 60 years with harvesting, or 100+ years for protected forests.
In simple terms, higher additionality and permanence = higher carbon credit price. A good example here is technology-based direct air capture credits, which have clear additionality and near-infinite permanence (counted in the thousands of years) and which often sell for upwards of €500/tCO2e.
Besides additionality and permanence, another key value driver for projects is co-benefits like biodiversity improvements or community impact. Buyers are increasingly willing to pay more for projects that have additional benefits or which abide by more stringent rules aimed at, say, increasing the biodiversity in their forests.
Finally, carbon projects do also follow some cost-based logic— buyers are willing to pay more for projects where they understand that the carbon credit price is in relation to the effort expanded. This is why active land restoration projects such as afforestation can command higher per tonne prices than something like avoided deforestation. As a rule of thumb, the more complicated and labour-intensive the process, the higher the price of resulting credits.
How are carbon credit prices likely to evolve?
Ultimately, prices are defined by the buyers’ priorities. Historically, buyers were looking for scale at a low price; however, this attitude is changing.
Many corporate buyers now expect a higher level of additionality and permanence, and are willing to pay for co-benefits that align with their goals, such as ecosystem protection and biodiversity. Additionally, some buyers are focusing more on the provenance of credits, preferring to buy from projects that have a direct impact in their local geography.
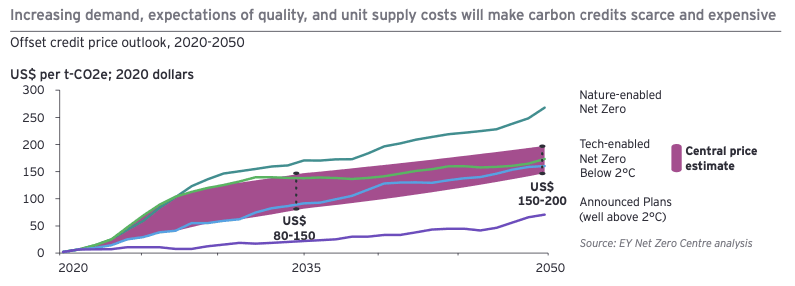
Looking forward, we expect prices to converge by project type, but retain the different price scales depending on additionality, permanence, locality and high-co-benefit vs low-co-benefit projects. Beyond this convergence, we expect overall prices to increase as demand grows— for example, EY’s Net Zero Centre analysis expects prices to be in the range of $80-150 per tCO2e by 2035.